Utilizer

Energy Procurement

We provide bespoke business cases, feasiblity studies and net zero roadmaps.
Reduce costs and consumption while improving sustainability credentials.
Improve energy efficiency and enhance ESG credentials
Manage your utility accounts resolve problems, validate invoives

Latest Insights

Solar panel
January 01,2023

Energy Market Update: May 2025

| Author
Energy Market Update May

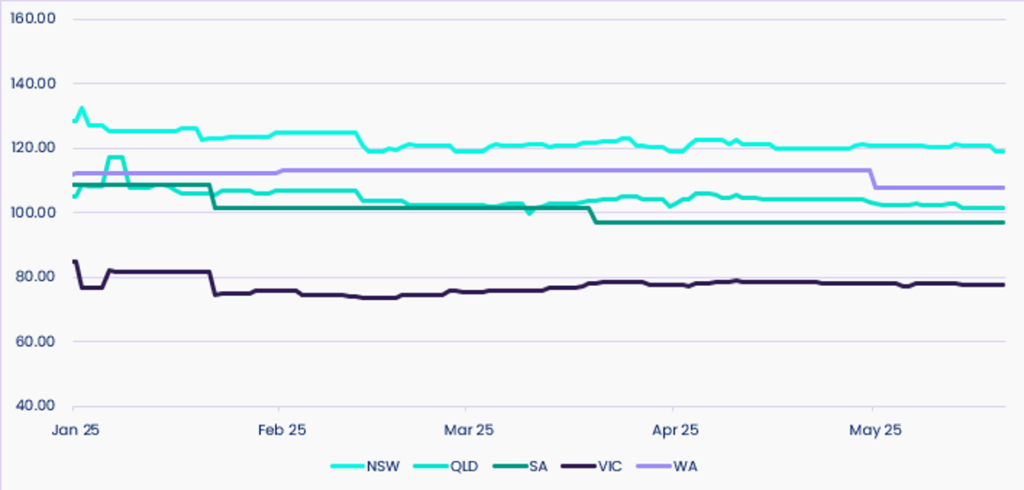
After quite a volatile start to the year, electricity markets across the East Coast have steadied throughout May. Futures prices in NSW, QLD, and VIC have remained relatively flat, with only South Australia recording a modest decline, thanks to its strong renewable generation mix.

As winter looms and broader energy policy debates intensify, now is the time for businesses to keep a close eye on contract opportunities, forward pricing trends, and emerging supply-side pressures.
Electricity Prices

  • Victoria: 
    In Vic, prices have remained the lowest across the NEM, holding at around $77.14/MWh, which is a change of less than 0.5% since the beginning of May. The market has experienced a period of relative calm following minor fluctuations in April. Despite this, the state remains susceptible to swings driven by coal generator performance and renewable variability.
  • New South Wales:
    Electricity prices in NSW have remained relatively steady throughout May, month-to-date. Futures traded at around $120.12/MWh as of 15 May, showing minimal movement (less than 1%) since the start of the month. Prices have steadied after a sharp jump in April, but things could still change quickly depending on how reliable generators are and what happens with fuel costs.
  • Queensland:
    QLD’s futures hovered at approximately $102.41/MWh mid-month, reflecting negligible change since 1 May. Despite earlier price sensitivity caused by cyclonic conditions and outage-driven volatility in March and April, May has so far presented a more settled outlook. Forward pricing suggests the market has settled for now, but cooler months could still shake things up.
  • South Australia:
    SA has seen a 1.7% decline in electricity futures, closing at $92.97/MWh on 15 May. The downward movement is attributed to the state’s continued high share of renewable energy, particularly wind generation, which consistently makes up over 60% of supply. Favourable weather and steady energy supply from other states have helped keep prices down for now.

ASX Energy Futures ($/MWh)

Gas Prices

  • Victoria:
    VIC prices rose a more modest 5.9% YoY to $12.14/GJ, with notable MoM softness (-4.1%) across February to April. This suggests temporary relief from peak seasonal demand. While VIC benefits from robust storage capacity and interconnection, long-term concerns remain as Bass Strait production continues to decline. Winter pricing will depend heavily on import volumes and demand management, particularly during peak periods.
  • New South Wales:
    Spot gas prices rose 11.7% YoY, from $11.93 to $13.33/GJ over the quarter, with gains spread evenly across the quarter. Prices dipped slightly by 1.3% MoM from February to April, suggesting stabilisation after summer demand pressures eased. Elevated prices are underpinned by persistent southern supply declines, with reduced output from the Bass Strait and rising pipeline inflows from the north. The AER continues to flag ongoing tightness through winter, and forecasts aligned with international LNG-linked pricing are keeping forward prices elevated.
  • Queensland:
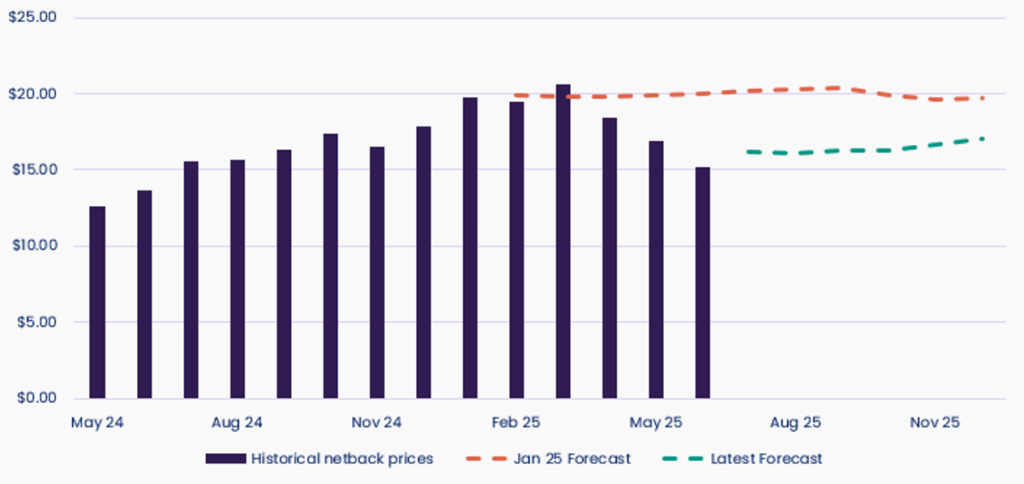
    Spot prices in QLD averaged $13.58/GJ, up 13.2% YoY from $12.04. Monthly volatility was low, with only a 0.4% dip from February to April. LNG export demand and strong linkage to international netback pricing continue to drive QLD’s higher average. March saw a netback price spike to $20.59/GJ, widening the domestic-external pricing gap. While exports provide price support, any shifts in global LNG sentiment could significantly impact QLD pricing dynamics.
  • South Australia:
    SA recorded the strongest YoY rise in Q1 spot prices, up 14.8% from $11.89 to $13.65/GJ. Prices were flat from February to April, indicating a potential plateau following strong summer-driven peaks. SA’s gas market remains tight due to intermittent renewables and frequent reliance on gas-fired generation. Regulatory bodies continue to cite system balancing risks and potential supply gaps heading into winter as key concerns.
  • LNG Netback Prices:
    Netback prices have risen 16.8% YoY, from a 2024 average of $15.09/GJ to a projected $17.63/GJ in 2025. However, prices fell 17% from January to mid-April, down from $19.94 to $16.63/GJ, as global LNG supply stabilised and Asian spot demand weakened. Despite this fall, forward netback forecasts remain high ($19.7–$20.3/GJ) through Q3–Q4 2025, which continues to influence east coast contract pricing trends.

LNG Netback Prices

EnergyAustralia's Apology Over Carbon Offset Claims

EnergyAustralia recently issued an apology to over 400,000 customers for potentially misleading claims about its "go neutral" carbon offset program. The company settled a legal challenge alleging greenwashing, marking a significant precedent in Australia's energy sector.

This highlights just how critical transparency and traceability are in environmental claims. Businesses that rely on carbon offsetting or green credentials should ensure they can verify claims and avoid overstating impact.

What does this mean for you?

If your business is making environmental or sustainability claims, whether it's carbon neutrality, renewable usage, or emissions reduction, you need to be able to back them up. Our team at Utilizer can help assess your current sustainability positioning and support credible reporting to maintain trust with your stakeholders.

New Energy Efficiency Standards for Commercial Buildings in 2025

The Australian Building Codes Board (ABCB) has released proposed updates to the National Construction Code (NCC) 2025, introducing enhanced energy efficiency requirements for commercial buildings. These changes are part of the ongoing 'Trajectory for Low Energy Buildings' policy, aiming to reduce greenhouse gas emissions and support Australia's commitment to net-zero by 2050.

Key Updates:

  • Enhanced Thermal Performance: New commercial buildings will need to meet stricter thermal performance standards, improving insulation and reducing energy consumption for heating and cooling.
  • Improved Building Services Efficiency: Upgrades to lighting, HVAC systems, and other building services are mandated to enhance overall energy efficiency.
  • Renewable Energy Integration: Provisions to facilitate the integration of on-site renewable energy systems, such as solar panels, are included to encourage sustainable energy use.

These updates signify a significant shift towards sustainable building practices in the commercial sector. For C&I businesses, this presents both a challenge and an opportunity to invest in energy-efficient infrastructure that can lead to long-term cost savings and compliance with evolving regulations.

What Does This Mean for You?

If you're planning a new commercial build or major upgrade, the changes to NCC 2025 may influence your plans. Understanding how the updated standards could affect energy use, infrastructure choices, and long-term operating costs will be key to making informed decisions and avoiding compliance issues down the track.

Australia's Renewable Energy Targets at Risk

Consultancy Wood Mackenzie has projected that Australia is unlikely to meet its goal of generating 82% of its electricity from renewable sources by 2030, estimating a shortfall with only 58% renewable generation. The shortfall is attributed to state-level policy rollbacks, delays in connecting projects to the power grid, and insufficient investment.

What does this mean for you?

Potential delays in renewable energy integration could lead to continued reliance on traditional energy sources, affecting energy prices and availability. C&I businesses should monitor these developments and explore opportunities for on-site renewable energy generation or long-term power purchase agreements to mitigate potential risks.

Tasmanian Smelter Suspension Highlights Energy Market Vulnerabilities

Liberty Bell Bay, the only major plant in Tasmania that makes metal blends for steel, has paused operations—putting over 250 jobs at risk. The shutdown happened because its main iron ore supplier was cut off after Cyclone Megan last year. On top of that, rising global prices and new U.S. tariffs have made things even harder. The plant is also one of Tasmania’s biggest energy users, making up around 7% of the state’s electricity demand.

What does this mean for you?

This situation shows how easily things like supply issues or global price changes can disrupt business operations—especially for energy-hungry sites. If your business relies heavily on a single supplier or uses a lot of energy, it’s worth thinking about ways to protect yourself, like improving energy efficiency or having backup supply options.

Winter’s coming, and so are new risks and opportunities. If you’re reviewing contracts, planning upgrades, or reassessing strategy, now’s the time to act. Reach out today and let’s make sure you’re set up for smarter energy decisions.