July has continued to test the resilience of Australia's energy systems. While electricity futures have been largely stable, behind the scenes the market danced between softening sentiment and shifting supply dynamics. Spot market outcomes were stronger than June, helped by improved wind conditions, but volatility remains just one weather pattern or outage away.

Source: ASX Energy Futures
Victoria:
Vic recorded the largest price spread this month at 4.4%, with futures peaking at $81.64/MWh and closing at $79.27/MWh – a 2.9% decrease. This softening reflects steady supply conditions and a rebound in wind generation, which helped contain volatility and ease demand on gas peakers. While sentiment has cooled for now, Victoria remains sensitive to wind variability and interconnector constraints - making ongoing monitoring key.
New South Wales:
NSW electricity futures fell 1.8%, from $121.40/MWh to $119.26/MWh. Despite elevated demand, improved renewable output and fewer unplanned outages kept a lid on prices. However, NSW remains one of the more exposed states during inter-regional shortfalls - especially when neighbouring wind or interconnector capacity falters.
Queensland:
QLD futures edged down 1.0%, from $103.04/MWh to $102.04/MWh. The standout trend was in the spot market, where 77% of intervals between 11am and 1pm recorded zero or negative pricing - underscoring the state’s heavy solar penetration and the impact it’s having on midday volatility.
South Australia:
SA was the only state to record an uptick, with futures rising 1.1% to $95.45/MWh. The lift reflects a combination of lighter-than-average wind and multiple LOR (Lack of Reserve) notices from AEMO, suggesting pressure on reserve margins. It’s a reminder of how quickly the state can swing from renewable oversupply to tight conditions.
Tasmania:
Tasmania’s wholesale regulated prices have edged lower over the past four weeks, with pricing decreasing slightly from $57.00 to $56.85/MWh. Notably, 0% of wholesale intervals recorded negative spot pricing in July - highlighting the absence of grid-scale solar generation in the region, which continues to shape the state's intraday price profile differently from mainland NEM states.
New Zealand :
NZ faced fresh winter pressure in July, with spot prices climbing past NZ$230/MWh during a multi-day cold snap in the lower North Island. Limited wind output and firming capacity shortfalls triggered short-term stress on reserves. The government’s recent pivot away from a 100% renewables target continues to influence investment signals, with storage and backup thermal increasingly in focus.


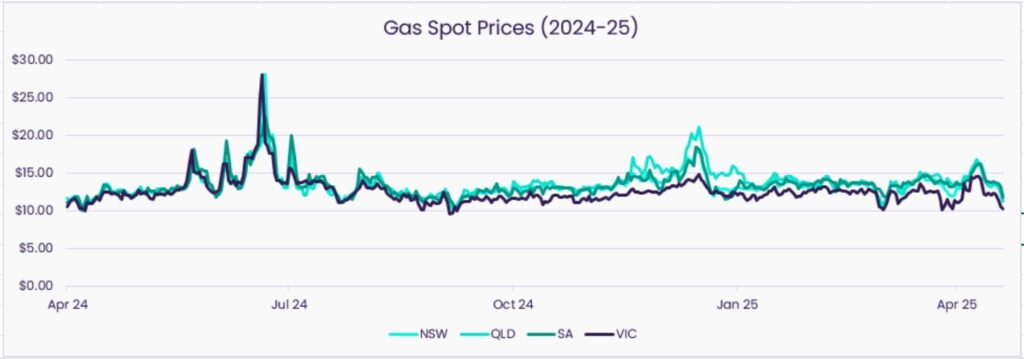
Source: AEMO STTM and DGWM Spot Market Data
Victoria:
VIC gas prices rebounded from $9.93/GJ in May to $12.72/GJ in June, a 28.1% increase – the largest month-on-month gain across the NEM. The spike reflected colder weather and inter-seasonal storage dynamics, with drawdowns increasing ahead of winter's peak. Into July, conditions moderated slightly, helping ease some of the upward pressure, though storage reliance remains a key watchpoint. Prices are still 21.0% lower than June 2024, underscoring the broader softening trend in the east coast gas market.
New South Wales:
NSW gas prices rose from $10.94/GJ in May to $13.37/GJ in June – a significant 22.2% month-on-month increase, reversing the softness seen earlier in Q2. This uplift followed a sharp but short-lived cold snap in late June that lifted heating demand across the southern states. July brought more stable weather, and with it, a settling in spot market conditions. Despite the June lift, prices remain 18.6% lower year-on-year, reinforcing the market’s structurally weaker footing compared to 2024.
Queensland:
QLD gas prices climbed from $11.26/GJ in May to $14.07/GJ in June, a 25.0% increase, driven by late-June volatility and export-linked demand. However, the trend softened through early July as weather conditions stabilised and production remained consistent. Year-on-year, prices are still down 11.97%, highlighting the shift away from the sustained highs seen during last winter’s tight conditions
South Australia:
SA gas prices rose from $11.40/GJ in May to $13.61/GJ in June, a 19.4% gain month-on-month. The increase was tied to a run of low-wind days and cooler temperatures, which lifted gas peaker demand. July saw fewer reserve warnings and more consistent renewables output, helping ease market tightness. Prices remain 15.6% below where they sat in June 2024, reflecting improved supply-side resilience.
Tasmania:
Tasmania’s gas usage remained minimal in June, with no significant change from May. The state’s reliance on hydroelectric generation and Basslink imports continues to keep gas demand, and therefore price exposure, low.
New Zealand:
NZ gas demand increased in June as colder weather took hold across the North Island. Thermal generation was called upon more frequently to support the grid, especially during evening peaks and periods of low wind. While the spot gas market in NZ is less transparent than Australia's, signs point to tighter supply margins, particularly with continued uncertainty around legacy fields like Pohokura and Kupe. Although prices are largely governed by contract structures, rising demand and capacity constraints are sharpening the focus on firming reliability and long-term fuel availability.
LNG Netback:
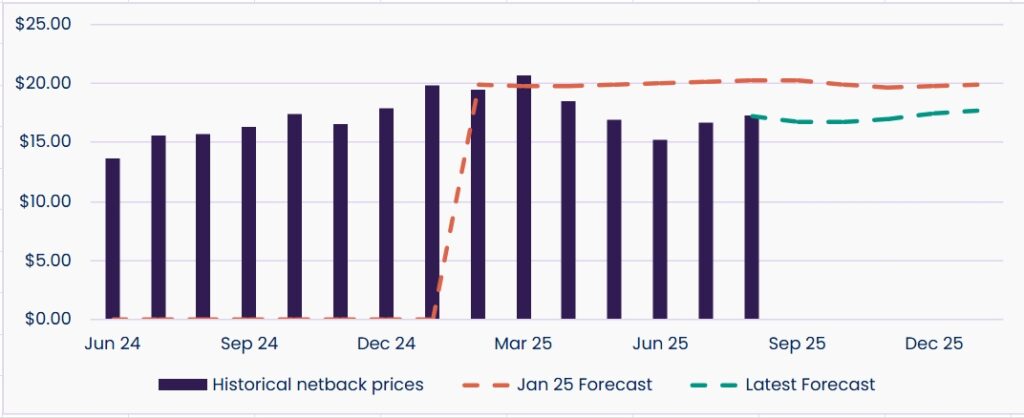
Netback prices lifted from $15.21/GJ in June to $16.64/GJ in July, reversing the softening trend seen in early Q2. While the January 2025 forecast expected Q3–Q4 prices to remain above $20/GJ, the latest outlook has been revised down to between $17.04 and $17.76/GJ. Despite the downgrade, forward pricing remains firm enough to influence east coast contract negotiations and planning for large users.

LGC spot prices have fallen to $12.50 – the lowest level in over three years – as surging supply runs ahead of both compliance needs and corporate demand. Despite forecasts of a booming voluntary market, actual uptake has lagged, putting downward pressure across the board.
More than 28 million LGCs were created in just the first half of 2025, while annual demand (including both compliance and voluntary) sat closer to 42.5 million in 2024. With issuance on track to exceed 54 million this year, the oversupply gap is only widening.
What does this mean for you?
If your strategy involves LGCs – whether you're buying, selling, or forecasting – this is a critical moment to reassess.
The market isn’t just soft – it’s oversupplied and signalling a shift. Strategic positioning now could pay off later.
June and July have seen a flurry of announcements and commissioning milestones for grid-scale batteries across NSW, VIC, and QLD. Yet AEMO’s June Connection Scorecard shows many assets still stuck in commissioning or operating at partial output. Regulatory bottlenecks, grid constraints, and technical integration challenges continue to limit the speed at which storage is fully operationalised.
While the number of committed battery projects has grown significantly, system-wide firming capacity remains dependent on gas peakers and interconnector flows – especially during low-renewables periods.
What does this mean for you?
Market conditions are changing faster than the headlines. Whether you’re managing PPAs, exposure to spot pricing, or relying on renewable firming, now’s the time to pressure-test your assumptions. Forecasts, contract structures, and contingency plans matter more than ever — real capacity, not just project announcements, will determine outcomes.
New Zealand recorded record-breaking wind output in early July, with multiple days of near-zero wholesale electricity prices. While great for renewables headlines, the volatility also highlighted system management challenges – particularly for thermal generators and price stability.
The trans-Tasman example echoes the growing pains of Australia’s own transition: when wind delivers, prices collapse; when it doesn’t, stress rises fast.
What does this mean for you?
Expect more extremes – not fewer. If your portfolio relies on timing arbitrage, demand-side response, or spot exposure, this kind of volatility should be factored into strategy. What we saw in NZ could easily play out in SA or VIC under the right conditions.
Energy market dynamics are evolving faster than ever. From price spikes to policy shifts, staying ahead means more than reacting – it means planning with purpose.
Whether you need to review contracts, test scenarios, or uncover opportunities in renewables, now’s the time to act. Utilizer makes energy easy - let’s build the right strategy together. Reach out to see how we can help you. More power to you.
Australia’s Carbon Market: What Matters for C&I Energy Strategy in 2026
November 28, 2025
Energy Consultants: How the Best Reduce Risk for Your Business
November 26, 2025
Explore our monthly market wraps for a comprehensive outlook on the Australian energy market, and start making smarter energy decisions.

Energy consultants are critical partners for complex businesses because energy is no longer just a cost. It’s a strategic risk to manage and a commercial…
READ MORE