Winter is six weeks away, the LNG netback appears to have undergone a structural reset, and the market’s version of calm right now is still more expensive than it was at the start of 2026. Last month gave some breathing room. Electricity futures pulled back across every NEM region and east coast gas prices remain well below year-ago levels. If you were watching the headlines, you’d be forgiven for thinking the pressure had eased. It hasn’t. Here’s what moved in April and what it means heading into the colder months.
⚡ Electricity Market
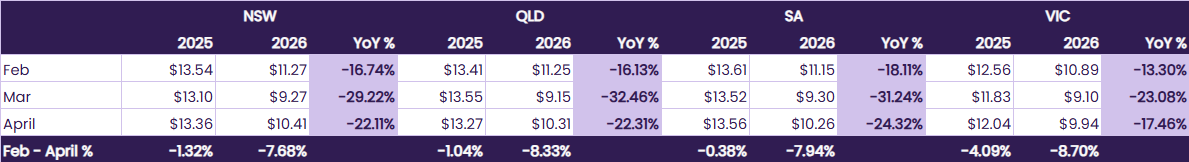
Every NEM region moved lower in April, but the scale of the correction varied significantly and the reasons behind each state’s movement tell different stories. NSW unwound the most aggressively, shedding 6.7% over the month as thermal generation risk eased slightly. Victoria barely shifted. The spread between the two states remains wide, and that appears to reflect a structural difference in generation mix that isn’t going away anytime soon.
What’s worth paying attention to now isn’t the monthly movement, it’s the trading ranges. NSW prices moved between $97.65 and $108.70 in a single month. That 11% intra-month swing seems to tell you more about current market conditions than the month-end number does. Retailers are working with that volatility in real time, and it’s showing up in shorter offer validity windows and more cautious pricing behaviour. If you’ve been finding it harder to lock in a competitive rate and hold it, that’s likely why.
The AER’s draft Default Market Offer for 2026–27, released in mid-March, pointed toward potential retail price reductions based on pre-conflict wholesale costs. That picture seems to have shifted. Businesses who were expecting meaningful relief on their next retail bill or contract renewal may need to revisit those assumptions against the current forward curve.
South Australia’s market appears to be behaving differently from the rest of the NEM right now. High renewable penetration is producing a high frequency of negative pricing intervals during daylight hours, which suppresses average spot prices but doesn’t meaningfully reduce the peak exposure that drives retail contract costs. For SA buyers, the spot average looks increasingly like a misleading indicator of actual risk.
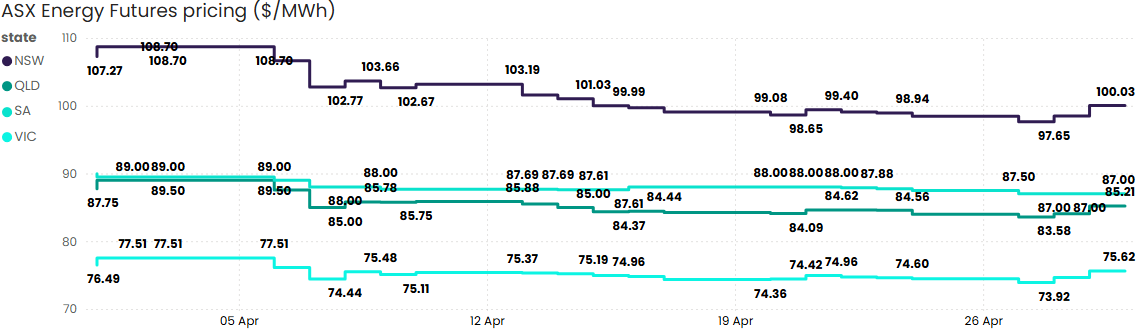
Source: ASX Energy Futures
🔥 Gas Market
East coast gas spot prices held well below year-ago levels through Q1, and on the surface that looks encouraging. Near-term supply conditions have genuinely improved, with the delayed Eraring retirement reducing gas-fired peaking requirements and battery storage eating into the peak demand events that gas has historically covered.
But that picture sits alongside some less comfortable signals heading into winter. Iona underground storage closed 2025 at its lowest level since 2021 and the ACCC has flagged a supply-demand balance of between a 12 PJ shortfall and a 3 PJ surplus in Q3 2026, depending on how much uncontracted gas LNG producers choose to export rather than retain domestically. For southern state buyers in particular, winter price risk looks higher than the current spot numbers suggest.
And on 7 May, the Federal Government confirmed the domestic gas reservation scheme, requiring LNG exporters to reserve 20% of their exports for domestic supply from 1 July 2027. Existing long-term export contracts are grandfathered, which limits the near-term impact, but the intent looks clear: a structural shift in how domestic and export gas supply is balanced over the longer term.
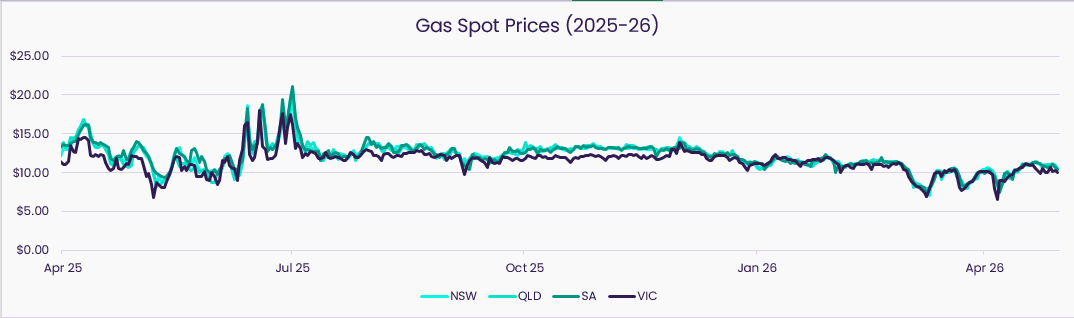
Source: AEMO STTM and DWGM
Source: AEMO STTM and DWGM
🌏 LNG Netback
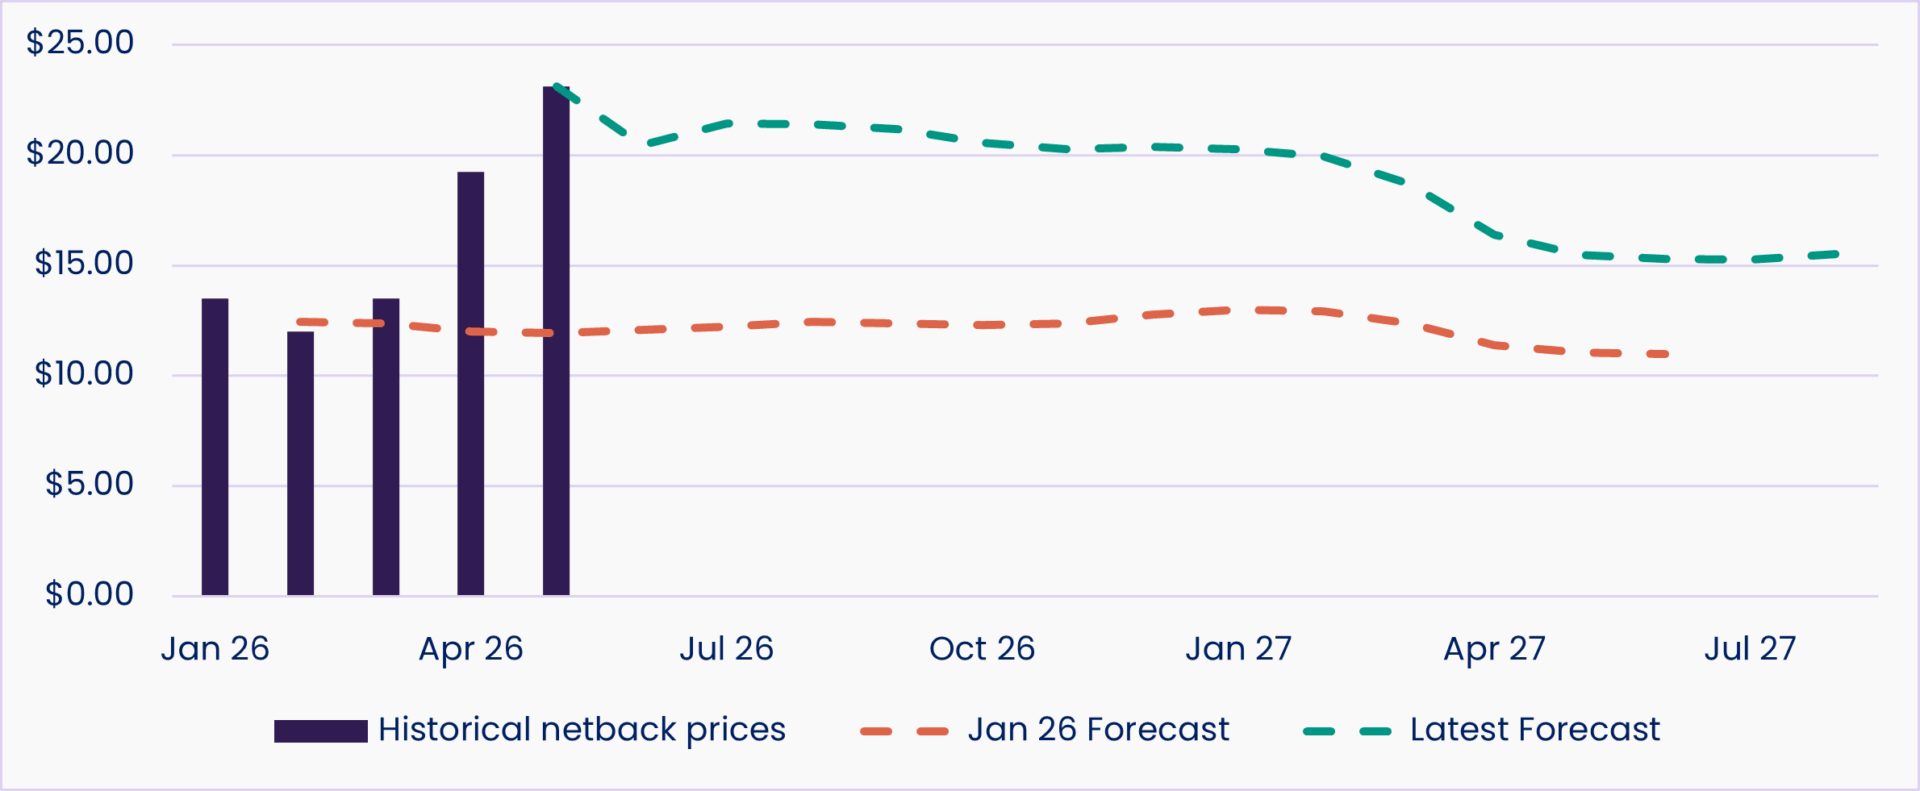
The soft domestic spot numbers are real, but the ACCC’s LNG netback price series suggests they may not be the right frame for planning ahead.
The latest forecast has moderated slightly from the prior period but still shows what looks like a clear structural step-change from May 2026. Prices appear to jump to around $23/GJ and look likely to hold in the $20–$23 range through the rest of 2026, before gradually easing and stabilising around $15–$16 into 2028. To put that in context: at the start of the year, before the Middle East disruptions hit, the netback was tracking around $12–$13/GJ. The forecast has roughly doubled from that baseline, and it looks like a new long-term floor for what domestic gas is worth to exporters relative to selling offshore.
When the netback rises, it makes it more commercially attractive to export gas than to sell it domestically. Over time, that tends to pull domestic contract pricing upward regardless of what’s happening in local spot markets. Businesses negotiating gas contracts in the current window may be doing so under more favourable conditions than those who wait another six to twelve months.
Source: ACCC LNG Netback Price Series
💧 New Zealand
NZ wholesale electricity prices surged more than 200% between February and March before beginning to ease in April, but the cause appears to have had nothing to do with the global fuel market volatility affecting Australia. It was water.
Around 80% of New Zealand’s generation is hydro-dependent. That’s a genuine structural advantage when storage lakes are healthy. But it creates a single, concentrated point of vulnerability when lake levels fall. That looks to be exactly what happened through late summer. As hydro storage tightened, the market called on thermal backup generation heavily, and the cost of that backup set prices across the entire wholesale market.
For Australian businesses with NZ operations or energy exposure, the episode is a useful reminder that a market’s risk profile isn’t just about its current price. It’s about where its vulnerability sits and what happens when that vulnerability is tested. NZ looked low-risk right up until it wasn’t.
👀 What We’re Watching
Iona ended 2025 at its lowest point in four years. The pace at which it’s being replenished ahead of winter will likely determine how much buffer Victoria and South Australia have if July and August demand comes in strong. We’re watching injection rates closely through May and June.
The current softness in gas spot prices has created a window for C&I buyers approaching contract renewal. Whether gas retailers hold current offer levels into winter procurement season, or begin pulling forward the LNG netback repricing into Q3 gas contract offers, will matter significantly for businesses with agreements expiring mid-year. The offers available right now may look more attractive in hindsight.
The 7 May announcement confirmed a mandatory 20% domestic reservation on LNG exports from 1 July 2027, with existing export contracts grandfathered. Detailed industry consultation is now underway on design mechanics. For businesses negotiating gas contracts that extend into 2027 or beyond, it’s worth understanding how the scheme may reshape domestic supply availability and pricing dynamics over that period.
South Australia’s high frequency of negative pricing intervals during solar hours is creating a market that seems to swing between extremes rather than settle at a midpoint. That pattern looks likely to make standard fixed-price procurement structures less efficient for SA buyers over time, and may affect the investment signals that shape SA’s generation mix over the next three to five years.
If any of these developments are relevant to your current position or upcoming decisions, talk to our team. We’re across what’s moving and can help you work out what it means for your specific portfolio.
Frequently Asked Questions
Prices fell in April. Doesn’t that mean the market is improving? +
The monthly correction is real, but context matters. NSW at $100/MWh is still significantly higher than it was at the start of 2026. What appears to have changed in April is the degree of urgency in the forward curve, not the underlying drivers. Global fuel prices remain elevated, LNG netback forecasts look to have structurally reset, and winter is approaching. A market that corrects after a spike isn’t the same as a market that’s returned to normal.
What does the LNG netback reset mean for my gas contract? +
The netback price is essentially the opportunity cost of keeping gas in Australia rather than exporting it. When it rises, producers appear to have a stronger commercial incentive to direct gas offshore, which tends to tighten domestic supply over time and pull contract prices upward. The current soft spot market looks like a window that the forward curve suggests won’t stay open indefinitely. If your contract is expiring in the next 12 months, the netback number is arguably more relevant to your procurement decision than the current spot price.
Should I be concerned about gas supply this winter? +
It depends on where you are and how you’re exposed. For Victorian and South Australian businesses with direct gas consumption, low Iona storage entering winter looks like a genuine risk factor the spot price isn’t currently reflecting. For businesses with electricity exposure linked to gas-fired generation in those markets, the same risk applies indirectly. The ACCC’s latest outlook puts the Q3 supply-demand balance anywhere between a 12 PJ shortfall and a 3 PJ surplus, depending largely on how much LNG producers choose to export versus retain domestically.
What is the new gas reservation scheme and what does it mean for buyers? +
The Federal Government announced on 7 May that LNG exporters will be required to reserve 20% of their exports for domestic supply from 1 July 2027. Export contracts signed before 22 December 2025 are grandfathered, which limits the near-term market impact. If it works as intended, the policy looks likely to put downward pressure on domestic gas prices over time by reducing the degree to which international LNG pricing can pull domestic contract prices upward. Whether it delivers that in practice will depend on the detailed design, which is still being finalised through industry consultation.
Why does Victoria have the most stable electricity prices but arguably the most gas risk? +
The two markets operate on different timescales and through different mechanisms. Victoria’s electricity stability appears to stem from its generation mix and interconnection, which seem to buffer it against the fuel cost shocks that hit NSW and QLD harder. But Victoria’s gas market relies heavily on Iona underground storage to meet peak winter demand, and that storage entered 2026 in its weakest position in four years. The electricity market and the gas market look like they’re telling different stories about the same winter.
I have operations in New Zealand. Should I be factoring recent price movements into my planning? +
The NZ market is showing early signs of stabilising after March’s spike, but the underlying vulnerability hasn’t changed. NZ’s hydro-dependent generation mix means lake storage levels remain the single most important variable in wholesale pricing. If storage doesn’t recover adequately before next summer’s dry season, similar conditions could return. For businesses with NZ exposure, it’s worth reviewing whether your contracts include appropriate protections around wholesale price pass-through while the market is relatively calmer.
Winter is coming.
Is your procurement strategy ready?
If you’re approaching a contract renewal in the next 12 months, it’s not too early to make sure you’re procurement-ready. Our team can help you make sense of the current market and position you to move when the right opportunity appears.