September delivered modest movements in electricity and gas markets, but underlying dynamics continue to shift in meaningful ways. Renewable output strengthened across the NEM, futures remained contained, and gas prices eased into spring conditions. As always, the goal of this update is to help you understand what changed, why it matters, and how it could influence your procurement decisions.
Whether you’re reviewing your current contract, planning ahead for 2025, or simply staying informed, here is what you need to know from September.
⚡ Electricity Market
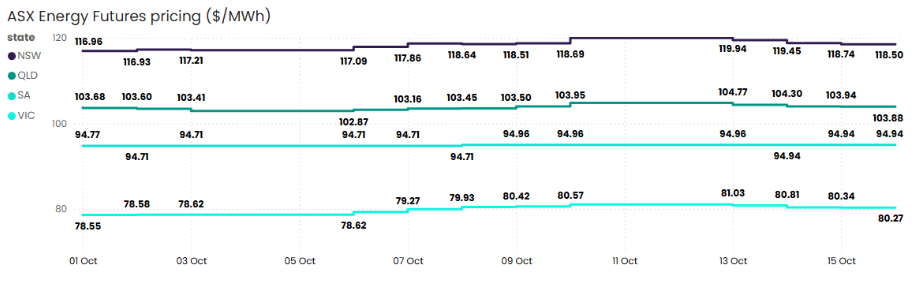
Source: ASX Energy Futures
New South Wales
NSW futures climbed 1.3%, rising from $116.96/MWh to $118.50/MWh. Prices traded within a $3.01/MWh band, reflecting moderate movement. Solar’s share increased from 13.3% to 16.7% and wind lifted from 13.9% to 17.0%, marking the strongest renewable growth of all NEM states. Stable demand conditions helped offset upward pressure from coal outages and interconnector constraints earlier in the month.
Queensland
QLD futures edged up 0.2% to $103.88/MWh. Volatility remained limited with prices ranging between $102.87/MWh and $104.77/MWh. Solar increased from 10.4% to 11.4% and wind rose from 8.4% to 9.4%. Overall, the Queensland market remained balanced with contained price movement.
South Australia
SA futures rose 0.2% to $94.94/MWh, trading in the tightest band of any region. Wind generation increased significantly from 65.8% to 69.8%, while solar eased slightly. South Australia remains the national leader in renewable penetration and continues to show the lowest volatility across the NEM.
Victoria
VIC futures recorded the strongest increase, rising 2.2% to $80.27/MWh. Prices ranged from $78.55/MWh to $81.03/MWh, reflecting moderate volatility. Solar increased from 4.4% to 5.8% and wind lifted marginally. Demand remained stable and renewable performance supported overall grid conditions.
Western Australia
In the WEM, average September prices remained stable, with no significant volatility recorded across the month. Gas and coal continued to provide the bulk of underlying demand and supported overall system reliability, with thermal generation remaining the backbone of supply as renewable penetration gradually increases.
🔥 Gas Market
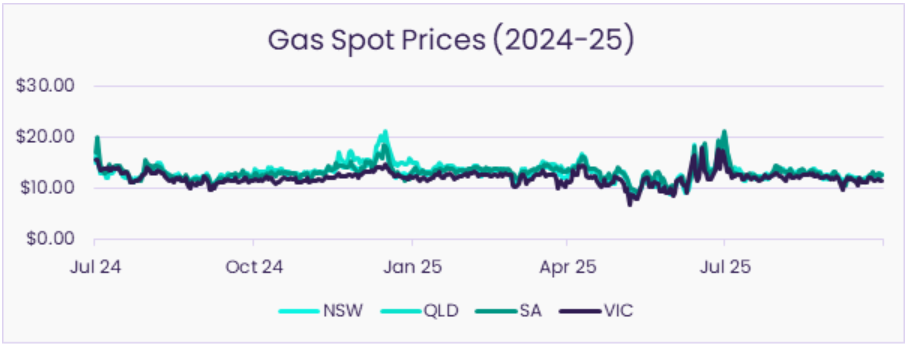
Source: AEMO STTM and DWGM
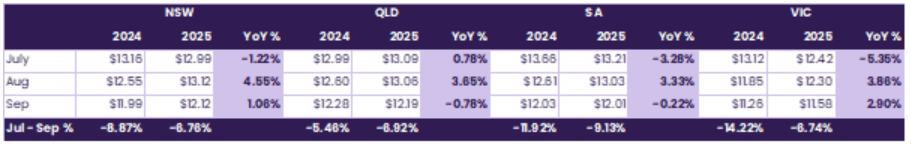
Spring conditions put downward pressure on gas prices across the east coast, with all regions recording month-on-month declines.
New South Wales
NSW prices fell from $13.12/GJ to $12.12/GJ, down 7.6%. Prices are sitting 1.1% higher than the same time last year, with steady demand and secure supply supporting longer term balance.
Queensland
QLD prices dropped 6.7% to $12.19/GJ, remaining close to long-term averages. Year-on-year movements remain stable and Queensland continues to be the most consistent east coast market.
South Australia
SA prices eased 7.9% to $12.01/GJ. Quarter-on-quarter declines reached 9.1%, smaller than last year’s winter exit. Prices are 0.2% lower year-on-year.
Victoria
VIC gas dropped 5.9% to $11.58/GJ. Prices fell 6.7% over the quarter, moderated by softer demand and improved storage. Prices remain 2.9% higher year-on-year.
🌏 LNG Netback
LNG netback prices declined from $15.64/GJ in September to $14.96/GJ. Earlier forecasts expected Q3 and Q4 to hold above $20/GJ, but global demand softness and steady supply have revised the outlook downward. Netbacks remain well above domestic spot prices, supporting continued LNG export competitiveness.
Key Market Themes to Watch
- Renewable surges are tightening the daytime pricing curve, increasing negative prices and shaping contract strategies.
- Gas markets are easing but netback softening suggests a more stable outlook for Q4.
- Retailer activity shows signs of shifting, particularly in offers targeted at daytime solar conditions.
Record Daytime Renewables Trigger Surge in Negative Prices
AEMO reported record renewable penetration across the NEM through September, setting the stage for a new national high in early October. Increased rooftop solar and strong wind output pushed daytime demand to record lows and led to a noticeable rise in negative prices in QLD, SA and VIC, particularly between 11am and 2pm. These conditions are becoming more frequent as spring solar ramps up and coal output is dialled back during low-demand periods.
What does this mean for you?
- For large energy users: more daytime price softness could create opportunities for flexible loads, scheduled charging, or shifting non-critical activity into cheaper windows.
- For procurement teams: expect greater divergence between daytime and evening contract value as negative prices place downward pressure on underlying futures.
- For corporates: renewable shaping risk becomes more meaningful as daytime oversupply expands and evening peak prices retain most of the cost pressure.
Retailers Begin Testing ‘Free Energy’ Offers in Response to Solar Oversupply
September saw the emergence of new “free energy” or ultra-low daytime cost offers for households and small businesses, prompted by deepening negative prices and abundant solar generation. OVO Energy’s Free 3 plan, offering free electricity between 11am and 2pm, reflects a wider trend of retailers responding to structural shifts in the daytime supply curve. While designed for smaller customers, the signal is relevant for the broader market.
What does this mean for you?
- For commercial and industrial buyers: daytime oversupply could influence future tariff structures, particularly for embedded networks and businesses with flexible load profiles.
- For energy managers: retail behaviour indicates increased pressure to monetise excess solar, which may translate into new commercial product structures over time.
- For strategy teams: this trend reinforces the value of reviewing your load shape and identifying where cost advantages may emerge as solar penetration grows.
Gas Prices Ease Across the East Coast as Spring Conditions Moderate Demand
Gas markets softened through September, with all east coast states recording month-on-month declines. Milder temperatures, stable supply, increased storage levels, and a weaker LNG demand outlook contributed to the easing. While netbacks remain above domestic spot prices, forward projections have shifted lower than early-year expectations, suggesting a more stable Q4 environment.
What does this mean for you?
- For gas buyers: the moderation in prices provides tactical opportunities for businesses considering short-term contracts or reviewing blended procurement strategies.
- For operations teams: stable supply and easing demand reduce the likelihood of stress events across the east coast hubs heading into summer.
- For finance and strategy leads: lower volatility supports more predictable budgeting, although structural LNG exposure still anchors longer term pricing.
Ready for what’s next?
If you want to understand how these shifts influence your portfolio or upcoming renewals, Utilizer is here to make energy decisions easier. Reach out to our energy experts to discuss your position and options ahead of 2026.
More power to you.